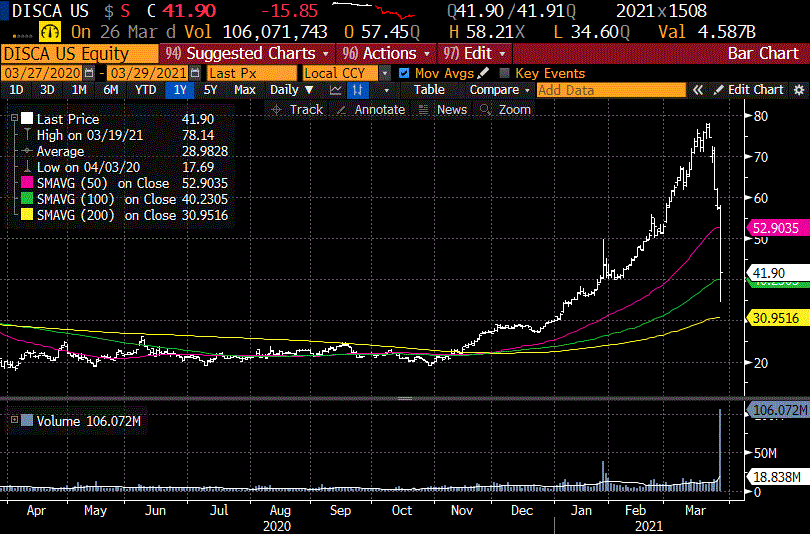
Price Discovery
March 28, 2021 -weekly comment

Someone “discovered” stocks don’t always go up. Above is a chart of Discovery Inc, one of the names in Friday’s block trade purge. There’s a lot of talk about the $10 billion-plus block sales on Friday, and the fund that was liquidated. It’s worth noting just a couple of the market cap changes. From March 22 to Friday, Baidu (BIDU) fell about $20 billion in value, with Discovery losing an equal amount since March 19. In fact, BIDU closed at 340 on Feb 19, and 208.61 on Friday, so the loss in market cap since mid-Feb is over $45 billion. Granted the closing price is still above the closing level for 2020, but these were massive moves.
From recent highs to Friday’s lows many of these stocks were cut to HALF PRICE. Here’s a list of stocks with highs from March 23 to lows on Friday March 26:
Baidu (BIDU) 263.71 to 174.05
Tencent Music (TME) 32.24 to 16.31
Vishop (VIPS) 46.00 to 24.98
Viacom (VIAC) 96.34 to 39.81
Discovery (DISCA) 72.42 to 34.60
Farfetch (FTCH) 61.46 to 41.25
IQiyi (IQ) 28.97 to 14.60
GSX Techedu (GSX) 83.57 to 29.40
I don’t know this list to be all inclusive. All still closed above the 12/31 closes, though some just barely. All had bounces off the lows. News reports claim the fund was highly leveraged and couldn’t meet margin calls.
**Late in the day at Goldmans offices: “We cleaned up all the stocks right?” “Yes, got out of everything.” “Good, I’m about ready for a cold beer. Where’s that annoying intern that keeps claiming he’s over-worked?“ Intern returns, clutching trading statements. “Boss, it looks like these guys might have been short SP futures as a hedge to their long stocks.”
I’m just joking of course, but could something like that have accounted for the ramp in the last hour of the day in ESM1 from 3908 to 3968 from 2:50 to 4:00?
We’re in a time where a loss of billions in a given fund barely causes a ripple. It’s not like 1998, where a loss of $5 billion by Long Term Capital Markets (LTCM) nearly brought down the system and sparked a bailout engineered by the Federal Reserve. It’s just a “one-off”. Like the ship stuck in the Suez Canal. It’s not as if there are currency devaluations and defaults like the 1997 Asian crisis and 1998 Russian crisis. Turkey… it’s a one-off. Just a temporary block in the plumbing. It seems to me we’re seeing a lot more “one-offs” recently.
It’s somewhat interesting that in 1997 to 1998 as the Asian Tiger crisis and LTCM unfolded, the ten year treasury yield went from nearly 7% to a capitulation low of 4.2% in the beginning of October 1998. The lack of buying in the ten year now underscores the nonchalance of the market with respect to possible risks. Or, maybe there IS buying, but massive supply nullifies the chance for a yield decline from what are already low levels, especially with inflation signals percolating.
While yields did fall on the week, with tens -6.8 bps from 172.6 to 165.8, the trend higher is still intact. The back end of the Eurodollar curve remains notably weak. EDU’25 closed at 9793.0, just 4.5 bps above the lowest close of the move which was the previous Friday at 9788.5. Once again, it’s worth noting that the ultimate low close for the second gold (18th quarterly) in the taper tantrum of 2013 was in September at 9617.0. Over 175 bps lower than the current level. The ten year topped at 3% vs 1.66% now. Perhaps the tantrum isn’t a suitable roadmap. However, we’re looking for nonfarm payrolls to be about 650k on Friday. Pre-covid there hasn’t been a payroll number above 400k in the past 20 years except for one post-GFC reading in May 2010 at 540k.
Truly interesting website on John Mauldin’s weekly piece, WTF Happened in 1971, (when Nixon abandoned the gold standard). It appears to be a huge inflection point. A lot of charts. In the 70’s inflation was running 5-10% and started 1980 around 15%. Fifty years ago.
https://wtfhappenedin1971.com/
Another informative article by Harley Bassman last week on vols and convexity
http://www.convexitymaven.com/images/Convexity_Maven_-_Lurking_at_the_Scene.pdf
OTHER MARKET THOUGHTS/ TRADES
The peak one-year ED calendar on the curve is still EDM23/M24 at 72.5. High settle has been 76.5 on 19-March. Interesting to note that greens to blues (3rd to 4th year) has been the steepest part of the curve. In part, this is due to the libor transition. While one-year calendars from greens to blues declined a few bps this week, blues to golds made new highs. As an example, EDM4/EDM5 closed at 55 on 19-March, but settled 56.0 on Friday with a new high print of 57. I find the direction of the blue/gold pack spread highly correlated to 10/30 treasury spread. The thirty year bond remains vulnerable to further inflation pressures.
| 3/19/2021 | 3/26/2021 | chg | ||
| UST 2Y | 15.2 | 13.9 | -1.3 | |
| UST 5Y | 89.7 | 85.4 | -4.3 | |
| UST 10Y | 172.6 | 165.8 | -6.8 | |
| UST 30Y | 244.8 | 236.6 | -8.2 | |
| GERM 2Y | -69.5 | -71.5 | -2.0 | |
| GERM 10Y | -29.4 | -34.6 | -5.2 | |
| JPN 30Y | 66.7 | 66.2 | -0.5 | |
| CHINA 10Y | 323.7 | 319.8 | -3.9 | |
| EURO$ M1/M2 | 9.5 | 8.5 | -1.0 | |
| EURO$ M2/M3 | 44.0 | 42.5 | -1.5 | |
| EURO$ M3/M4 | 76.5 | 72.5 | -4.0 | |
| EUR | 119.07 | 117.96 | -1.11 | |
| CRUDE (active) | 61.44 | 60.97 | -0.47 | |
| SPX | 3913.10 | 3974.54 | 61.44 | 1.6% |
| VIX | 20.95 | 18.86 | -2.09 | |

