All the same trade
December 20, 2020 – Weekly Comment
Above is a chart of the 2/10 treasury spread overlaid with Bloomberg Commodity Index. Like everything else, there appears to be a fairly high degree of correlation. In any case, 2/10 is at a new high for the year over 82 bps, a level not seen since late 2017.
It doesn’t really matter what data series one looks at. Almost everything is closing at the high or the low of the year. Dollar index, new low. Stock indices, new all-time highs. 2/10, new high. Red/gold euro$ pack spread, new high (since early 2017). Ten-yr tip breakeven, new high. Corporate spreads at or near the low of the year. Bitcoin, new all-time high. Soybeans, matching the high of 2016. Corn at 437 is at the high of the year, but about 30 cents away from last year’s peak, and a little over half the price of the all-time high in 2012. Copper, high since 2013. In a way, precious metals are laggards; victims of the great bitcoin rush. While gold is within $40 of the 2011 spike high of $1921, it’s not at a new high for the year (high in Sept was 2075). Silver is even more of a slacker: the high in 2011 was 50, but it’s now only about half that level and over $4 shy of this year’s high of 30. Bunker Hunt’s time has come again! WTI Crude is now near $50/bbl, but started the year around $64, and the high in 2008 was over $145/bbl.
Let’s take a closer look at 2/10. The level is 82, high of the year. High in 2010, the all-timer, is 291. The short maturity leg of any curve trade is handcuffed by the Fed’s promise to keep funding rates low. Longer maturities are thus constrained by low funding levels. Long treasuries are one asset class not marked by extreme levels. For example, the ten-yr yield started the year at 188 and is now 93 bps below that level as the Fed lopped 150 bps off the FF target early this year. The thirty-yr was 233 bps on Jan 2, and is now 63 below that level at 1.70%. Perhaps bonds aren’t as constrained by low funding rates as the markets (and Fed) assume. In terms of that assumption, here’s a quote from Jerome Powell’s press conference:
If you look at PEs, they’re historically high. But in a world where the risk-free rate is going to be low for a sustained period, the equity premium, which is really the reward you get for taking equity risk, would be what you’d look at. And that’s not at incredibly low levels, which would mean that they’re [stocks] not overpriced in that sense. Admittedly, PEs are high, but that’s maybe not as relevant in a world where we think the 10 year treasury is going to be lower than it’s been historically from a return perspective.
The question becomes, can some of these things reverse without affecting the others? For example, can stocks continue to rise even if bond yields press higher? This would necessarily imply a steeper curve, given the locked short end. Perhaps it’s instructive to go back to 1987. The ten-year started at around 7%, and the yield rose to over 10% as the DJIA was on its way to a 43% increase into September. The FF target was raised from 6 to 7.25% over the first three quarters of 1987. Of course, the crash occurred in October, taking the Dow down 28% from September’s high to the end of the year. The ten year fell from 10.23 to 8.75%.
My point is only that a lot of markets are at yearly extremes and are correlated, likely because of the remarkable liquidity provided by the Fed. Long end yields have more room to the upside than the market currently perceives. Of course, a sharp stock reversal would take yields down. Therefore, 2021 is probably a year for spread trading. For example… sell copper, buy silver?
Along this line of thought, the chart below is WTI Crude priced in copper (log chart, CL1/HG1). I’ve seen several analysts justify high copper prices due to the incredible expanding demand due to electric vehicles. This chart would appear to support that thesis in that oil is trending lower when priced in terms of copper. However, a contrarian couldn’t be faulted for going the other way on this one!
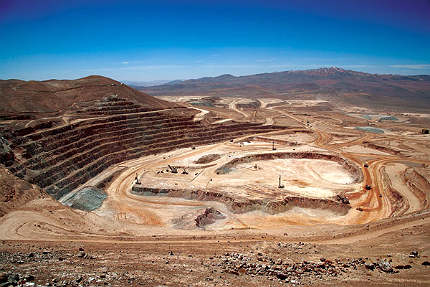
By the way, while everyone smugly believes they’re saving the planet from fossil fuel extraction by driving electric, it’s worth noting that copper mining can leave planetary scars as well. Here’s a picture of the Escondida mine in Chile. That’s where copper comes from.
| 12/11/2020 | 12/18/2020 | chg | ||
| UST 2Y | 11.9 | 12.1 | 0.2 | |
| UST 5Y | 35.9 | 38.0 | 2.1 | |
| UST 10Y | 89.1 | 94.6 | 5.5 | |
| UST 30Y | 162.4 | 169.8 | 7.4 | |
| GERM 2Y | -78.3 | -72.5 | 5.8 | |
| GERM 10Y | -63.6 | -57.1 | 6.5 | |
| JPN 30Y | 61.1 | 62.4 | 1.3 | |
| CHINA 10Y | 331.1 | 330.2 | -0.9 | |
| EURO$ H1/H2 | 2.0 | 2.5 | 0.5 | |
| EURO$ H2/H3 | 7.5 | 8.5 | 1.0 | |
| EURO$ H3/H4 | 29.0 | 30.0 | 1.0 | |
| EUR | 121.12 | 122.58 | 1.46 | |
| CRUDE (active) | 46.75 | 49.24 | 2.49 | |
| SPX | 3663.46 | 3709.41 | 45.95 | 1.3% |
| VIX | 23.31 | 21.57 | -1.74 | |

