Death of reflation is greatly exaggerated
November 8, 2020 – weekly comment
______________________________________
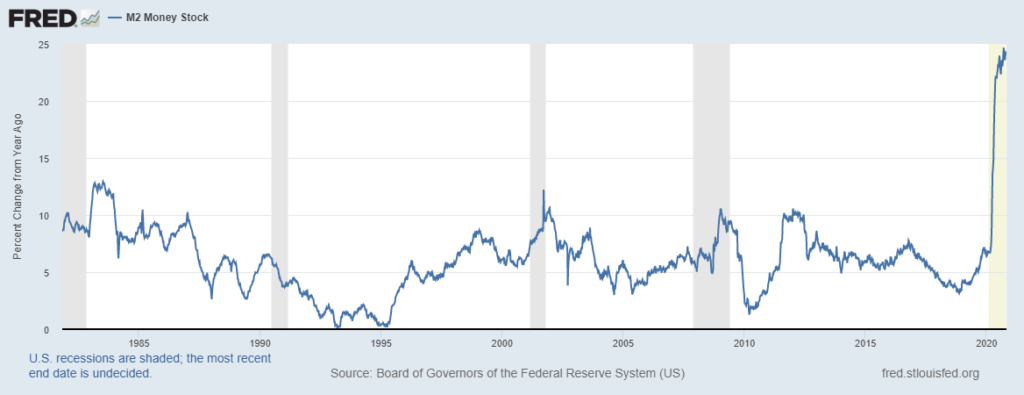
Chart of yoy M2 percentage growth:
This week has had commentators opining about the demise of the “reflation” trade. Bonds rallied as the probability for large stimulus lessened with the prospect of a Biden presidency and Republican Senate.
To delve a bit deeper into the demise of reflation, I would like to re-visit a paper written in May by Paul Tudor Jones and Lorenzo Giorgianni, The Great Monetary Inflation (GMI). It’s well worth reading the source paper which I have linked at bottom.
The press, as you may have recently noticed, tends to focus on juicy soundbites with or without context. “PTJ goes all in on bitcoin!” The paper is, of course, much more nuanced and interesting, perhaps even more so on a look back after six months have passed. Here are a couple of excerpts:
A large demand shortfall will prevent goods and services inflation from rising in the short term. The question is whether that will be the case in the long term with a central bank whose central focus will be repairing the worst employment crisis since the Great Depression.
To answer this question, we need to ask, how reasonable is it to expect that in the recovery phase the Fed will be able to deliver an increase in interest rates of a magnitude sufficient to suck back the money it so easily printed during the downswing? The current Fed leadership has made it a centerpiece of its new monetary policy framework to do whatever it takes to overshoot the inflation target in the recovery phase. This is a risky strategy.
Note that this was written in May, before the official Fed change of framework announcement in August. The inflation ‘overshoot’ is now official policy. Don’t fight the Fed! Most of the GMI note centered around the reflation theme and its counterpart, debasement of the currency. My question is, in the aftermath of the election, have things changed with respect to those themes? Perhaps there will be a smaller fiscal stimulus package. Maybe a comeback in global trade will grease supply chains and restrain prices. But that’s really about it.
A couple of more excerpts:
As Satoshi Nakamoto, the anonymous creator of Bitcoin, stated in an online forum around the time he launched Bitcoin, “the root problem with conventional currency is all the trust that’s required to make it work. The central bank must be trusted not to debase the currency, but the history of fiat currencies is full of breaches of that trust.”
So, when the time for lift-off finally occurs, any hiking cycle is likely to be delayed and unambitious. Furthermore, the risk of a complicit (politically-appointed) central bank chairman cannot be easily dismissed given that central bank independence is no longer a sacred cow.
The Fed has signaled its goal is to debase the currency. And it is asymmetrically stifling its reactive function. In terms of a complicit Fed, I think we have one. Trump did what he could to erode the independence of the Fed. This weekend we got a glaring example of what happens when the central bank is left to the devices of an autocrat. Turkey’s Erdogan again sacked the head of the central bank Murat Uysal, having fired the previous hand-picked chief Murat Cetinkaya in July 2019. Apparently rate cuts and depleting reserves are not the roadmap to a vibrant economy. The lira is in free fall. Powell’s term ends February 2022. Let’s hope his replacement isn’t a guy named Murat.
Here are the vehicles that PJT identified as a reflation hedge:
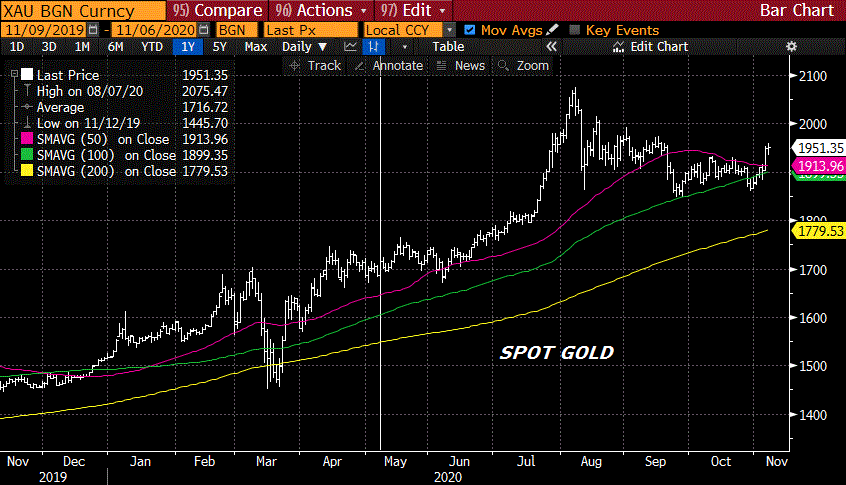
1.Gold–A 2500 year store of value
2.The Yield Curve–Historically a great defense against stagflation or a central bank intent on inflating. For our purposes we use long 2-year notes and short 30-year bonds
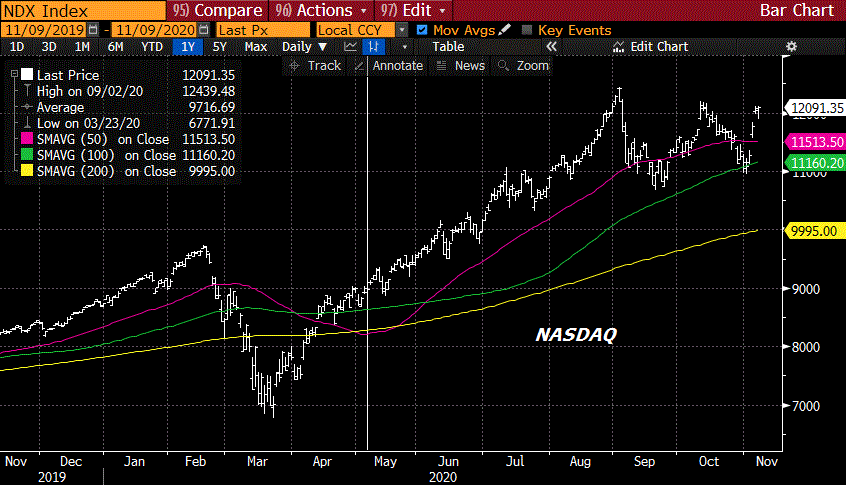
3.NASDAQ100–The events of the last decade have shown that quantitative easing can rapidly leak into equity markets
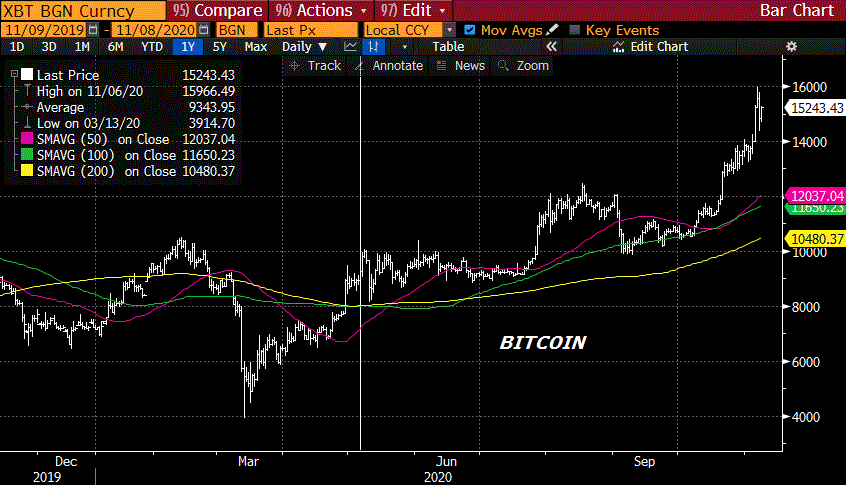
4.Bitcoin–There is a lengthy discussion of this below
5.US cyclicals (long)/US defensive (short)–A pure goods’ inflation play historically
6.AUDJPY–Long commodity exporter and short commodity importer
7.TIPS(Treasury Inflation-Protected Securities) –Indexed to CPI to protect against inflation
8.GSCI(Goldman Sachs Commodity Index) –A basket of 24 commodities that reflects underlying global economic growth
9.JPM Emerging Market Currency Index–Historically when global growth is high and inflationary pressures are building, emerging market currencies have done quite well
These suggestions have worked out, some in spectacular fashion, especially bitcoin, which hit a high of 10069 in early May (around the time of the paper) and touched 16000 this week.
The next two pages are charts highlighting a few of the trades, bitcoin, Nasdaq, gold and 2/30. The vertical line represents the time of the paper. Note that In October, PTJ still maintained that bitcoin’s rally is in the “early innings”.
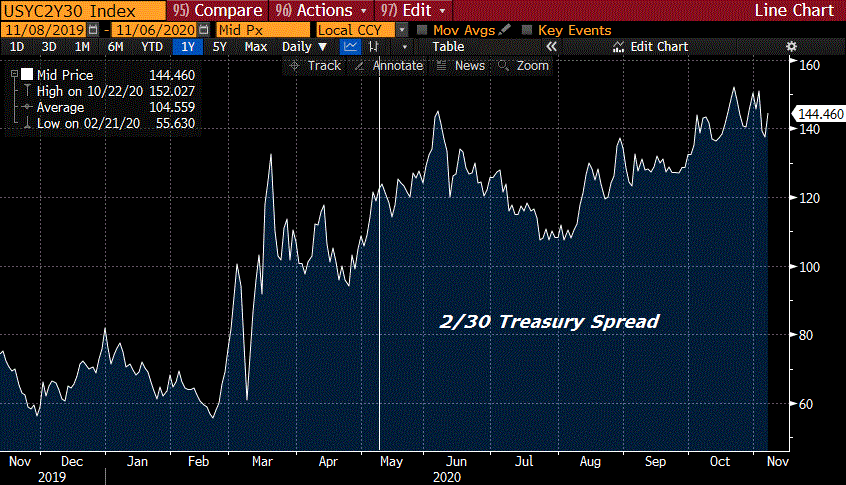
With respect to 2/30, now at 144 bps, I would note that the high of the past four years came right after Trump’s election, with a level of 203 bps on Nov 10, 2016. The high of the 2000’s has been 401 bps, in February 2011. The low since then has been 33 at the end of 2018, when the Fed was still tapering but unwittingly had its tightening campaign forced to an abrupt stop as stocks plunged.
Going forward, my thought is that gold and bitcoin remain strong as USD struggles. Commodities, especially ags, will continue to rally. Nasdaq and the curve are most vulnerable to declines if a new virus wave leads to lockdowns and the prospect of the Fed buying increased quantities of longer maturity treasuries. However, the more that the Fed is forced to openly monetize deficit spending the less confidence there will be in long-dated paper.
This week the ten year yield declined only 4.7 bps, as did the thirty year. Implied vol was absolutely crushed in rates. The Jan US atm straddle (174^) was 6’00 or 11.1 vol on October 30’s close. On Friday the atm 175 straddle for Jan was 4’00 or 8.0. Implied vol has recently tended to firm with higher rates and decline on rallies. This supports the idea of a simple retracement, rather than a change in the steepening trend. The lows in 2/30 in late July, early August of 107/108 will be a key level to hold, though I would doubt it even gets as low as 125 in the near future. My objective by year end is 170. In short, I believe the reflation theme is still alive and well. Look again at the top chart of M2 annual growth, consider the Fed’s new framework, and the healing qualities of a new stimulus program.
OTHER MARKET/ TRADE THOUGHTS
This week the treasury auctions $122 billion. $54b 3y on Monday, $41b 10y on Tuesday and $27b 30y on Thursday. CPI and PPI on Thursday and Friday.
On the week, Russell 2000 rallied 6.8% and SPX 7.3%. Going forward I expect further underperformance of RTY.
One of the interesting trades over the week concerns the libor to SOFR transition expected in January 2022. EDZ’21/EDH’22 calendar spread only rallied from 4 to 5 on the week, but there was a buyer of 60k of the spread from 3.5 to 4.5 on Thursday. The kink in the curve is apparent as EDU1/Z1 is 3.0, Z1/H2 is 5.0 and H2/M2 is just 1.0.
| 10/30/2020 | 11/6/2020 | chg | ||
| UST 2Y | 15.2 | 15.3 | 0.1 | |
| UST 5Y | 38.1 | 36.1 | -2.0 | |
| UST 10Y | 86.5 | 81.8 | -4.7 | w/I 83.7 |
| UST 30Y | 164.5 | 159.8 | -4.7 | w/I 159.7 |
| GERM 2Y | -74.4 | -78.0 | -3.6 | |
| GERM 10Y | -62.7 | -62.1 | 0.6 | |
| JPN 30Y | 64.3 | 62.6 | -1.7 | |
| EURO$ Z0/Z1 | -0.5 | 0.0 | 0.5 | |
| EURO$ Z1/Z2 | 10.0 | 10.0 | 0.0 | |
| EURO$ Z2/Z3 | 17.5 | 15.0 | -2.5 | |
| EUR | 116.47 | 118.77 | 2.30 | |
| CRUDE (active) | 35.79 | 37.14 | 1.35 | |
| SPX | 3269.96 | 3509.44 | 239.48 | 7.3% |
| VIX | 38.02 | 24.86 | -13.16 | |

