M2 and CPI
July 5, 2020 – Weekly comment
Friday’s payroll report was pretty much of a dud. NFP +4.767 million and the ten year yield barely budged, ending at 67 bps, 13 bps below the recent high yield of 90 bps set on the previous NFP released on June 5. In the week just ended, the US curve steepened, with twos -1.3 bps to 15.3 and thirties +6.3 to 1.433%. On a side note, in the land of yield curve control, the Japanese thirty-year ended the week at a new high of 64 bps, up from 30 in mid-March and 10 in September of 2019 (hasn’t been this high since March 2019). By contract the Japanese ten-year, which is what the BOJ had pledged to keep near zero, ended the week at 2.9, having been in a range of -5 to +5 bp since April.
Echoing the consistently higher yield in Japanese thirties is the trend is toward a lower nominal yield on the US ten yr inflation-indexed note, which was -75.2 bps late Friday, matching the low in 2013 and approaching the all-time 2012 low of -91. The breakeven spread between the ten-yr treasury and tip made a recent new high of 142 bps on Friday (high since early March). They are pouring into inflation protected securities. Why?
Here’s a tweet from Michael Ashton, @inflation_guy
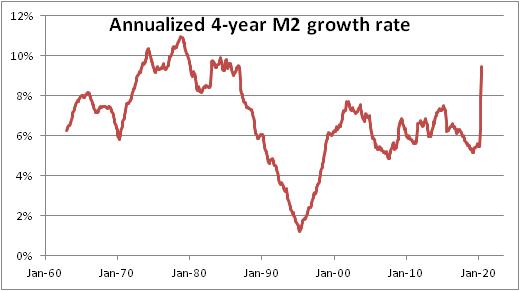
Got tired of posting 25% y/y M2 growth rates. So decided to look at rolling 4y M2 growth rates. Interesting that the data falls into >8% and <8% pretty cleanly. The former is 1970s to mid 1980s. Plus right now. Can’t imagine why that would matter…

So currently the rolling 4-year M2 growth rate is above 8%, as it was in the 1970’s. Why would it matter? Well in the decade from 1973 to 1983, inflation as defined by CPI was above 5%. That’s why. It’s never the case where the annual growth of M2 exceeds inflation (CPI) by over ten percentage points. Until now.
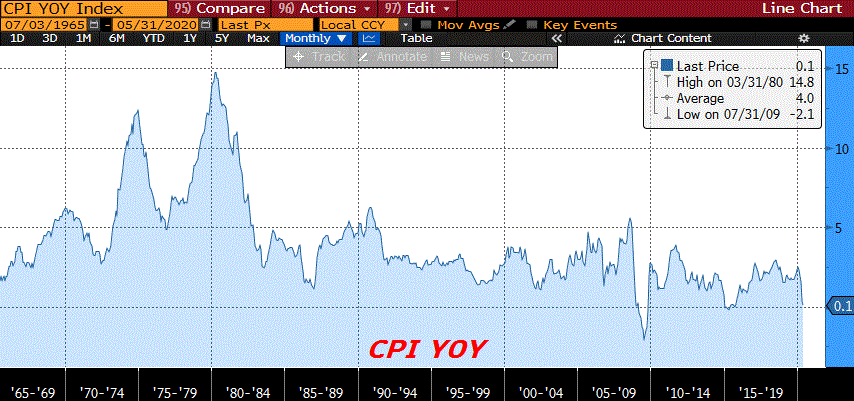
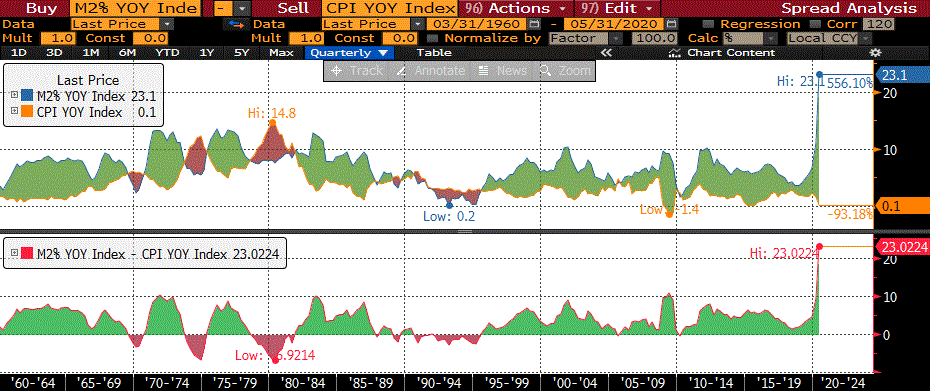
Below is a chart of CPI with last reading of 0.1%. Underneath that is a chart showing annual growth rates of CPI and M2, and a spread of the two on the lower panel. It appears as though inflation rates lag spurts in M2. Again, in the lower panel, the spread between the two doesn’t much exceed 10% since 1960. Now it’s 23%.


I again listened to a great lecture by Stephanie Kelton of Modern Monetary Theory fame from October 2018 (linked below). The presentation is well delivered, and of course temptingly seductive for the big spenders in the federal government. It’s basically superturboed Keynesianism. Keynes’ theory was that companies’ inventories may occasionally exceed INTENDED inventories, leading to unemployment and a decline in economic activity. Classical economists posited that interest rates would then fall and rekindle growth; Keynes argued that wasn’t necessarily the case, and at times of increasing unemployment and slack resource utilization the gov’t should step in to plug the demand shortfall. Kelton takes it a step further. The thrust of her argument is that the US Federal Government budget is nothing like a household’s budget because the gov’t can print the currency that its debts are denominated in. Therefore the budget deficit of the gov’t represents money spent into the economy which hasn’t been offset by tax collection, thereby driving growth and a surplus in the private sector. This extra spending is financed with bond sales. While these bonds are debts of the federal gov’t, they are assets to holders. Makes it all seem free, but of course the logical extension is that there is no limit to government spending to “help” the economy. That idea clearly collapses if all confidence in the currency is lost and high inflation results.
The national conversation, according to Kelton, is not “how to pay for a given program” but what the program should be, and what our poltical priorities are. In the short interview after the lecture she says the money should be spent “efficiently and judiciously”, which of course, dooms the theory from the outset, but she also talks about it in terms of putting slack resources to work. The limiting factor appears to be when resources are taut and price increases/inflation result. When has the government ever trimmed a program because of high resource utilzation?
One forward looking survey after another indicates that the public believes future inflation is heading higher. Lower nominal tip yields and a higher breakeven seem to corroborate this idea as does M2 growth. By the way, Trump just signed a five week extension for the Paycheck Protection Program. MMT is here. Now we will find out if/where there is a limitation. Growth in M2 makes me believe it will show up sooner rather than later in real-time price data.
OTHER MARKET/ TRADE THOUGHTS
Less than four months ago the Fed slashed the FF target by 150 bps. 2EZ 9975 straddle, which settles on 11-Dec of this year with EDZ’22 as underlying, settled at just 20.5 bps. The market is convinced that short end rates aren’t going anywhere over the next couple of years.
While the end of February and March saw tremendous volatility in the 3m libor setting, the forward spread represented by FFF1-EDZ0 has anchored between 26 and 30 for the past three months. The bigger picture is a repeat of the above: that the Fed has funding markets under control and will not allow another libor surge.
Copper has been rallying since mid-March and crude oil has rallied ever since the ridiculous decision in mid-April to allow futures contracts to trade negative. Both of these moves appear to be running out of steam, in need of a good pullback at the very least.
Treasury auctions 3, 10 and 30 year paper this week. As of yet, supply hasn’t been an issue; low yielding US dollar denominated bonds are being viewed as a safe asset, or at least an asset that the Fed will support in perpetuity. However, it bears watching how well long end paper is being received in this environment.
| 6/26/2020 | 7/2/2020 | chg | ||
| UST 2Y | 16.6 | 15.3 | -1.3 | |
| UST 5Y | 29.7 | 29.6 | -0.1 | |
| UST 10Y | 63.5 | 66.9 | 3.4 | |
| UST 30Y | 137.0 | 143.3 | 6.3 | |
| GERM 2Y | -70.2 | -68.0 | 2.2 | |
| GERM 10Y | -48.2 | -42.8 | 5.4 | |
| JPN 30Y | 57.7 | 64.1 | 6.4 | |
| EURO$ U0/U1 | -8.5 | -7.5 | 1.0 | |
| EURO$ U1/U2 | 5.0 | 5.0 | 0.0 | |
| EURO$ U2/U3 | 14.0 | 14.5 | 0.5 | |
| EUR | 112.21 | 112.30 | 0.09 | |
| CRUDE (active) | 38.49 | 40.65 | 2.16 | |
| SPX | 3009.05 | 3130.01 | 120.96 | 4.0% |
| VIX | 34.73 | 27.68 | -7.05 | |
(Stephanie Kelton presentation)

