pop
June 28, 2020 – Weekly comment
Sometimes it’s sort of funny when things go ‘POP’. But sometimes people get mad in what has become a humorless society. Which often makes it funnier.
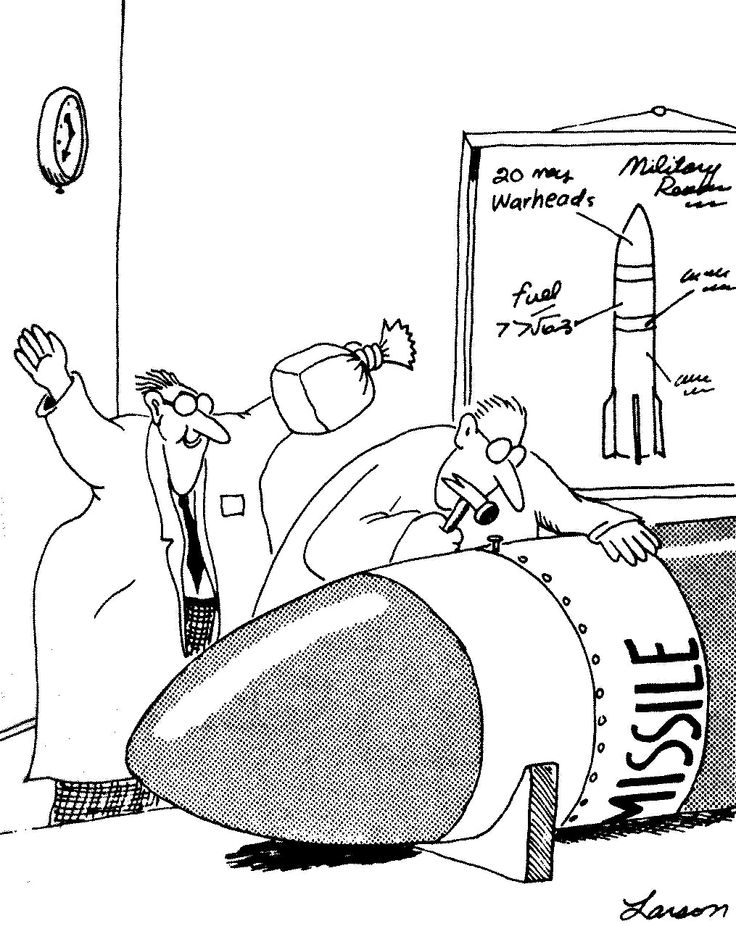
(FROM GARY LARSON/ THE FAR SIDE)
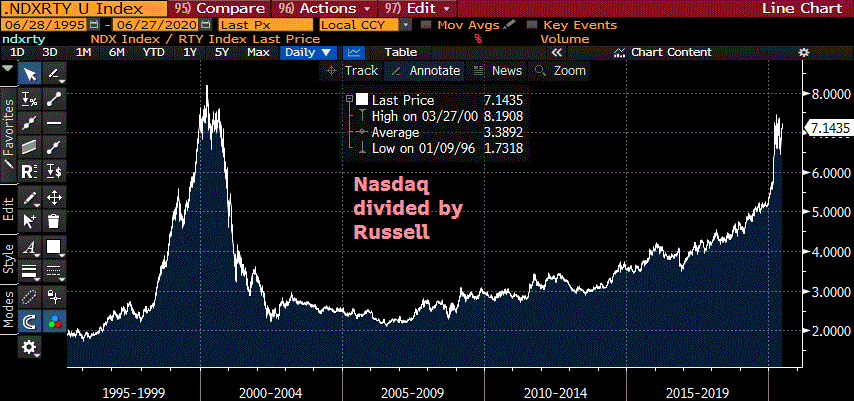
I am just going to post a few charts, and yes, I am plagarizing these ideas in part. Does that matter if I modified the chart data? Anyway, the first one is the ratio of Nasdaq to Russell 2k. I stole this one from Lance Roberts of RealInvestmentAdvice, (linked below) but he used SPX, which is even more dramatic because it’s at a new high. There’s no reason this ratio can’t go to ten I suppose. However, the wide ranges in the year 2000 are being echoed currently, and that to me is a sign of bearish instability.
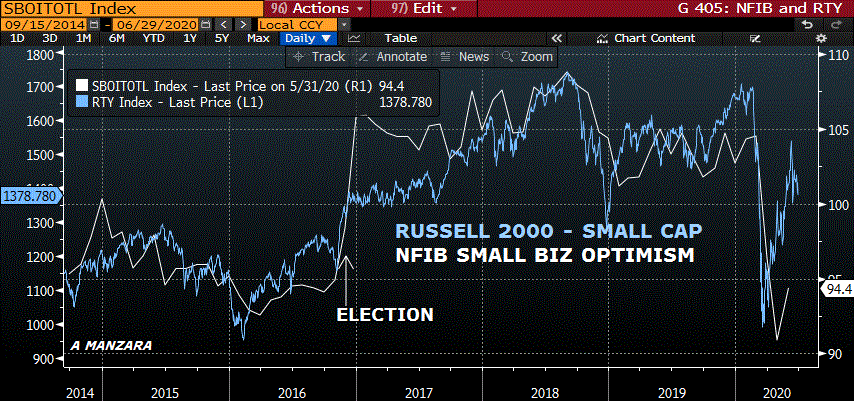
The next chart is one I came up with myself. The NFIB Small Business Optimism Index has closely tracked the Russell since 2009. Optimism really perked up after Trump was elected and the shackles of regulation were eased. The Russell caught up by 2018. Ironically, current NFIB is almost the same level it was prior to the last election (94.1 in September 2016 as Hillary looked like a shoe-in, and 94.4 now). In my mind, the outcome of this election, no matter who wins, will not likely have the same positive effect on confidence and animal spirits. Therefore, I believe the Russell rally is suspect, partially confirmed by the modest bounce in NFIB. Perhaps that’s how the NDX/RTY ratio will make a new high.
Yields continued to decline this week with tens ending the week at 63.5 bps and thirties at 1.37%, down nearly 10 bps since the previous Friday. As mentioned during the week, the 10-yr inflation indexed note yield is at a new low of -70 bps, within 20 of the historic low at the end of 2012.
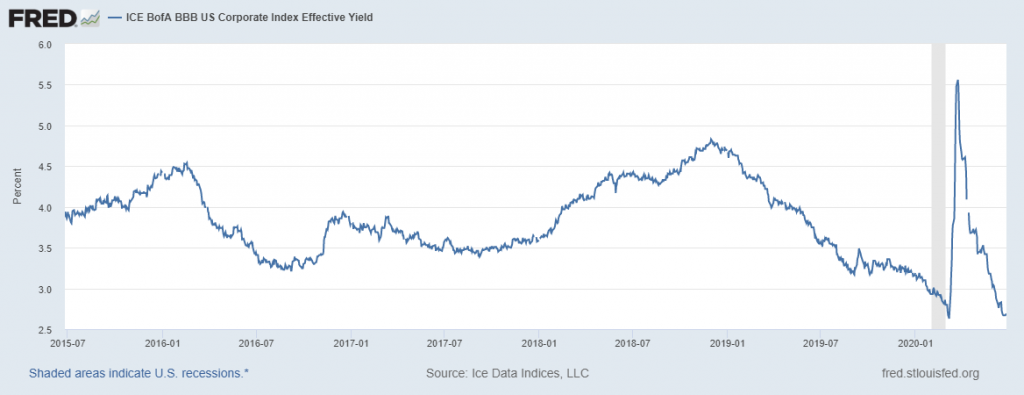
Below is the BBB effective yield from the St Louis Fed website. It has completely retraced the corona spike, even though the effects of the pandemic are nowhere near over. The current level is 2.7%. How are these companies able to borrow capital so cheaply?! Let me take a step back and consider the following: if I had 50 friends ask me if I would lend them money at a rate of 2.7%, if just two of them stiffed me, I would have a negative rate of return. It goes without saying I wouldn’t lend to me at that rate. Of course, the commercial bank credit card rate is over 15%. The delinquency rate on credit card loans is 2.73% (and rising). At least there’s a generous cushion in that spread. But there’s no cushion in this rate. It doesn’t matter…to the Fed. I get it.
OTHER MARKET/ TRADE THOUGHTS
There was a buyer Friday of Dec’20 100.125 calls at 1.0 bp ref 99.695. Peak euro$ contract is EDU’21 at 99.815, just 18.5 bps. Jan and Feb 2022 Fed Fund contracts (the furthest out listed) settled at the high on the curve at 100.015; negative yields. This at a time when the majority of Fed officials including Powell have said that negative rates are not an appropriate policy tool for the US. The market is forcing the issue in spite of the fact that Nasdaq, even with Friday’s sell off, is essentially at the level of the initial all-time-high in February (pre-Covid).
The vol crush in rates leaves TY at 3.6 to 3.7, back to pre-Covid levels. Given economic and social instability, vol is a much easier buy than sale. Shortened holiday week still includes the employment report on Friday, and the stock market is back to pricing weekend risk.
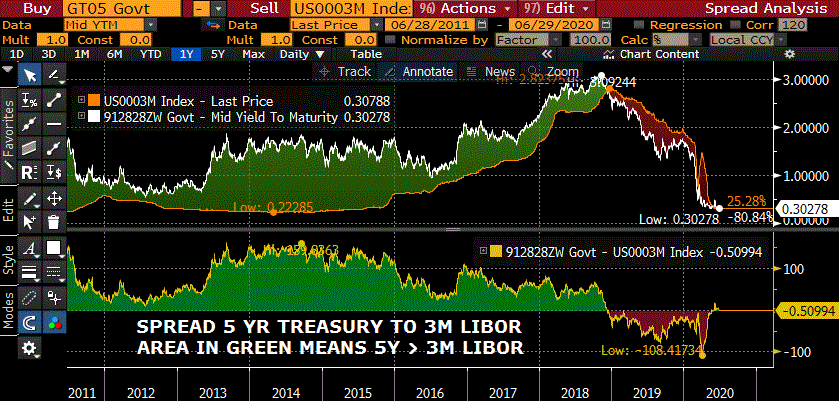
The chart below is three month libor vs the five year treasury yield. The red shaded area at the lower right hand corner shows that since the end of 2018, the libor rate (a proxy for bank funding) has been above the 5-yr treasury. We still haven’t really healed from the Q4 2018 stock sell off, and there are all sorts of bubbles: economic, social, geopolitical, just waiting for another pin.
| 6/19/2020 | 6/26/2020 | chg | ||
| UST 2Y | 18.5 | 16.6 | -1.9 | |
| UST 5Y | 34.0 | 29.7 | -4.3 | |
| UST 10Y | 69.7 | 63.5 | -6.2 | |
| UST 30Y | 146.6 | 137.0 | -9.6 | |
| GERM 2Y | -66.9 | -70.2 | -3.3 | |
| GERM 10Y | -41.5 | -48.2 | -6.7 | |
| JPN 30Y | 56.6 | 57.7 | 1.1 | |
| EURO$ U0/U1 | -8.5 | -8.5 | 0.0 | |
| EURO$ U1/U2 | 6.0 | 5.0 | -1.0 | |
| EURO$ U2/U3 | 15.0 | 14.0 | -1.0 | |
| EUR | 111.79 | 112.21 | 0.42 | |
| CRUDE (active) | 39.83 | 38.49 | -1.34 | |
| SPX | 3097.74 | 3009.05 | -88.69 | -2.9% |
| VIX | 35.12 | 34.73 | -0.39 | |

