Fed pumps, vol dumps
January 12, 2020 – Weekly comment
Starting this week with a chart on volatility. The white line (right hand scale) is TY vol and the green line (left hand scale) is VIX. The high in VIX (>35) occurred at the end of 2018, as stocks were crumbling after the Fed’s final December 2018 hike. The next high coincided with the TY high in August of 2019, when US/China talks were tense and the 2/10 spread inverted with treasury yields plunging to new lows, (30 year reached a record low below 2%). TY vol remained elevated with the mid-Sept repo scare, from 5 to 5.5.
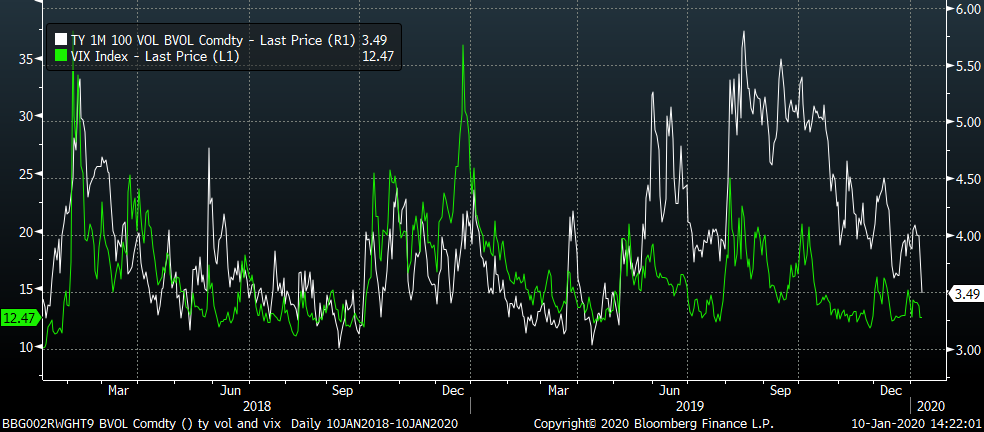
The end of 2019 and start of 2020 features vol at the low end of the ranges. This, when the world was supposedly close to the start of WW3 with the US eliminating Irani General Soleimani. Barely a blip in what are sometimes considered ‘fear’ measures. As Louis Winthorpe III says in Trading Places, “Fear? That’s the other guy’s problem.” No matter how much the US deficit explodes the market remains convinced that the Fed will supply liquidity. Indeed, in the last FOMC minutes release, it was suggested that the Fed move out to buying short dated coupons if there were no longer enough t-bills available for purchase. By implication, if we buy all of THOSE, then we’ll just keep monetizing further out the curve.
It’s in this environment that I again highlight the following
trade: Buying EDM0 9837.5 puts and Selling 0EM 9837.5 puts paying mostly 1.0 to
1.25. Settlements Friday were as follow;
EDM0 9834.0, EDM1 9848.5 so the EDM0/M1 calendar -14.5.
The 9837.5p in EDM0 settled 10.25 with -0.57d.
0EM0 9837.5p settled 8.50 with -0.36d.
Spread of 1.75. If the market
remained right here at expiration five months from now, the trade is a
winner: EDM0 puts would be 3.5 in the
money while 0EM 9837.5 puts would be out of the money. When considering a possible roll to the
current MARCH levels, the trade looks even better, with EDH0 9827.5 (10 itm) and
EDH1 9849. In fact, why not just buy the
9837/9825 put spread in EDM0 to sell the 0EM puts? That’s exactly how some have entered the
trade.
To give a sense of size, on Jan 2 open interest in EDM0 9837.5p was 219k and on Friday 297k. 0EM puts went from 31k to 93k. So it’s safe to say that this idea has been expressed at least 60k. By the way, EDM0 9825 puts rose from 565k on Jan 2 to 724k on Friday. The ‘pit’ (market makers) are said to be long over a million of the 9825 put strike; the sum of March, June and Sept is 1.67 million (520k, 724k and 425k) mostly due to the 9812.5/9825/9837.5 put butterfly strips that had been bought in huge size.
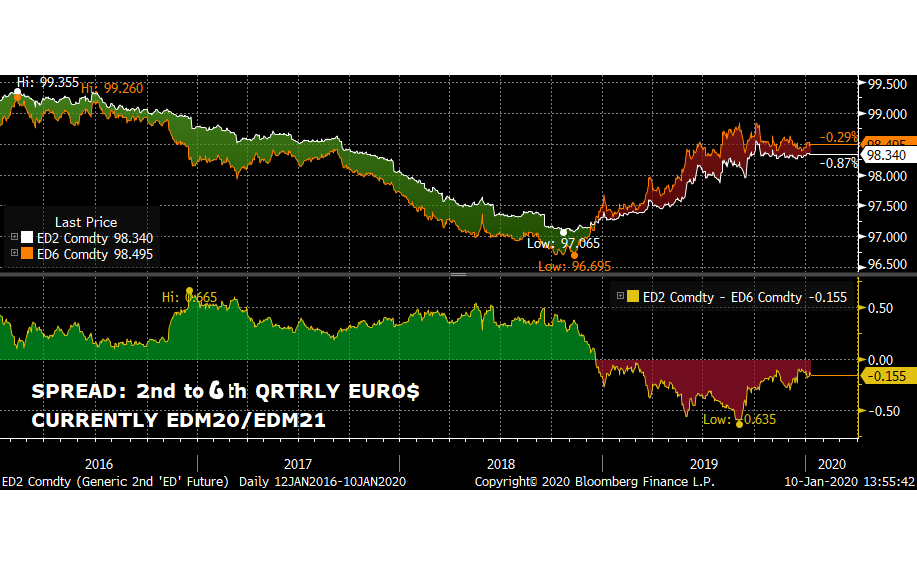
But let’s just take a closer look at the one-year futures calendar spread. The EDM0/0EM 9837.5 put spread is dependent on EDM0/EDM1 remaining inverted, and as mentioned above it’s now -14.5.
Below I have posted a couple of charts. The top is a rolling ED 2nd to 6th quarterly one-year spread, which is currently EDM0/M1. The red shaded portion in the lower panel is when that spread and other near one-yr calendars inverted. This was the market saying the Fed had made a mistake with the December hike and would have to ease. At that time the FF target was 2.25 to 2.50%, and it’s now 1.50 to 1.75%, so clearly the signal was correct.
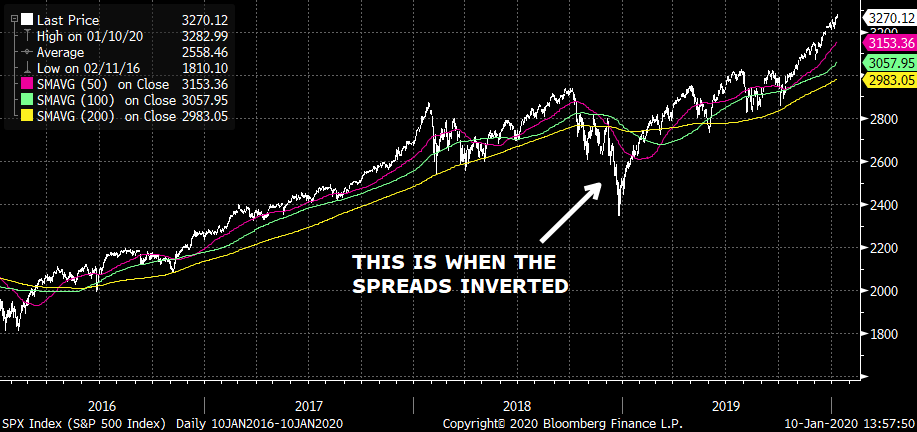
It’s also worth taking a look at this chart in the context of the SPX (below). When ED calendars inverted, SPX was nearing its 20 pct drawdown at the end of 2018. At the time, not only was the Fed raising the FF target, it was also draining $50 billion/month from the balance sheet. One year later, in Q319, the Fed began aggressively increasing its balance sheet and in October announced the $60 billion per month t-bill buying program. Stocks responded in predictable fashion, exploding to new highs. SPX is now about 10% higher than it was at its high in Sept 2018, prior to the Q4 sell-off. In Sept 2018, the 2nd to 6th one-year eurodollar calendar was PLUS 30 to 35.
In summary, the Fed eased three times in 2019. It has massively increased the balance sheet. Economic data remains firm. The Federal Gov’t ran a deficit of $980 billion. Fed officials are saying policy is in a good place. Some measures of inflation are firming. The markets are shrugging off geopolitical concerns. Stocks are at all-time highs. The Phase I trade deal is set to be signed this week, along with an agreement to start semi-annual talks between US/China to resolve disputes. Is this really the time to enter trades predicated on ED one-year calendar spreads remaining inverted?
This week brings CPI on Tuesday, with Core yoy expected 2.3%. PPI is Wednesday with Core yoy 1.3%. Retail Sales and Philly Fed on Thursday, Industrial Production on Friday. The most important day may well be January 15, when the Phase I agreement is scheduled to be signed. It’s also a tax day and settlement of last week’s auctions, so once again the Fed will be pumping hard to avoid any semblance of a repo spike.
OTHER MARKET/TRADE THOUGHTS
An article in the Wall Street Journal detailed how the Swiss Embassy in Tehran provided a secure, private, conduit for diplomacy to de-escalate the US/Iran confrontation even as public rhetoric suggested the exact opposite. That’s not to say that we’re immune to geopolitical mistakes, but it’s a reminder that behind-the–scenes conversations are always taking place, (even in matters of monetary policy).
As noted above and during the week, there is a heavy weight on vol and on the front 9825 strike in particular. EDH0 9825 put settled 2.25 vs EDH0 9827.5. EDM0 9825p settled 2.25 as well, vs 9833.5 and EDU0 9825p settled (and traded) 3.0 vs 9840.5. In just the past couple of sessions, EDU0 9825p lost ¼ of its value vs the same futures price; it had traded 4.0 and settled 3.75 on Wednesday vs 9840/40.5. The market perceives zero chance of the Fed snugging policy; these puts are a cheap buy just in case the market is wrong. Eight months for the Sept puts for 3 bps while EDH puts are still 2.25?
There are myriad warnings about stocks being too high, and several Fed officials have openly worried about contributing to imbalances, notably Kaplan. I will just mention a couple of snippets taken from news outlets and twitter. Goldman’s Kostin says S&P valuation is stretched historically, trading at 90th percentile. Market cap to GDP is at an all-time-high. John Authers (BBG) notes that S&P 500 has hit record after record while NIPA earnings have flatlined. @TeddyVallee tweets “Past 2 years SPX companies spent $114 on buybacks for every $100 in capex. Prior 19 years were $60 per $100 of capex.” While I prefer downside plays in rate futures, an unexpected slide in stocks from high levels could occur at any time. I would note that Crossborder Capital, using data back to 1969, says the current episode is the Fed’s greatest liquidity boost EVER on a 12 month rate of change.
| 1/3/2020 | 1/10/2020 | chg | |
| UST 2Y | 152.3 | 156.8 | 4.5 |
| UST 5Y | 158.8 | 163.3 | 4.5 |
| UST 10Y | 179.1 | 182.1 | 3.0 |
| UST 30Y | 225.2 | 228.2 | 3.0 |
| GERM 2Y | -61.9 | -60.0 | 1.9 |
| GERM 10Y | -27.8 | -19.9 | 7.9 |
| JPN 30Y | 41.1 | 43.6 | 2.5 |
| EURO$ H0/H1 | -25.5 | -21.5 | 4.0 |
| EURO$ H1/H2 | 3.0 | 3.0 | 0.0 |
| EUR | 111.60 | 111.22 | -0.38 |
| CRUDE (1st cont) | 63.05 | 59.04 | -4.01 |
| SPX | 3234.85 | 3265.35 | 30.50 |
| VIX | 14.02 | 12.56 | -1.46 |

