‘Triggered’ by eurodollar calendar spreads
Oct 20. 2019 – Weekly Comment
EDH20/EDH21 settled at a new recent high on Friday of -19.0 bps. March 2020 ED contract settled 9836.0 and March 2021 settled 9855.0. As the chart below shows, this spread reached a low of -40 in the beginning of September and has now exceeded its previous high made in summer. In my last note, I said that the week ended Oct 4, (when twos ended at 1.38%, tens at 1.50% and thirties at 2.00%), felt like capitulation. Treasury shorts threw in the towel. Tens finished this week at 1.75%. ED2/ED6 (the 2nd to 6th quarterly, now represented by EDH0/H1) is back to the level seen in the early part of Q2. If tens were back at that level they’d be 50 to 75 bps higher.
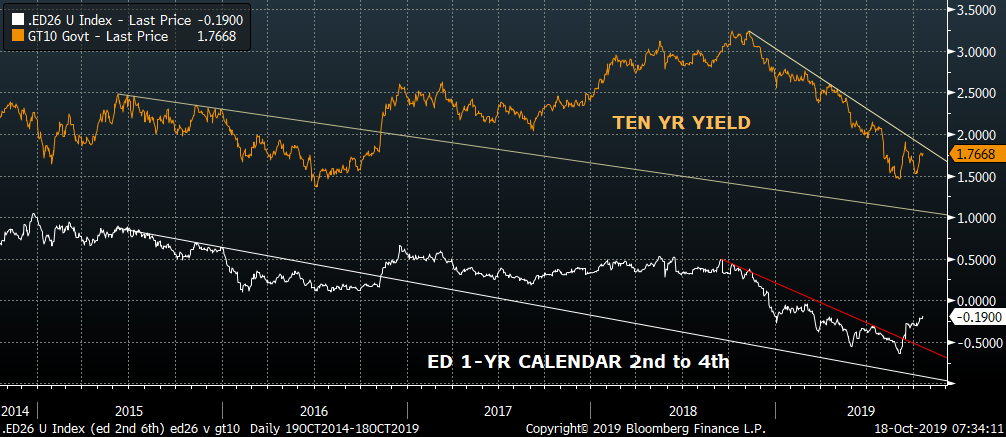
Ten year yield, amber / One-year euro$ calendar 2nd to 6th quaterly, white
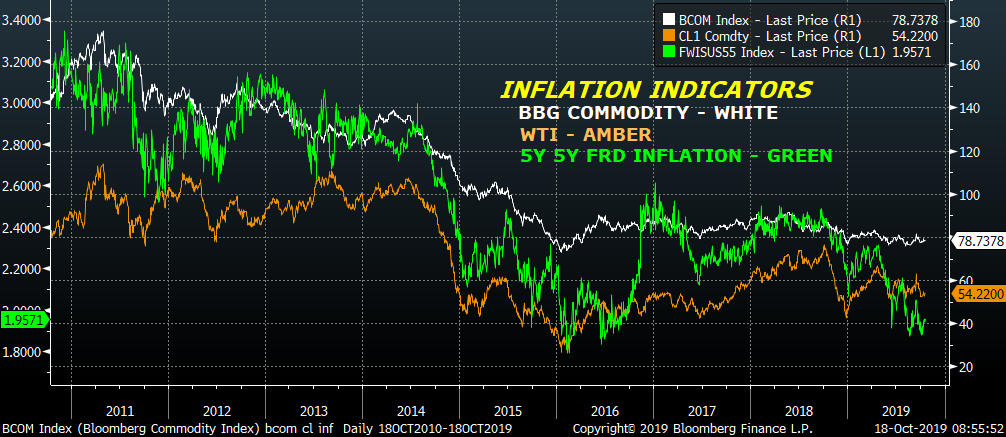
Below I include a chart with the BBG Commodity Index, Oil and the 5-year 5-year forward inflation swap, all of which are roughly related to inflation. Prices appear to be mired in quicksand. We know all the reasons that inflation can’t seem to accelerate: demographics, slow growth and technological innovation. I was completely struck by an article I had cited several years ago that starkly noted how new technologies had supplanted demand for a lot of other STUFF. The i-phone replaced bulky alarm clocks, stereo systems, cameras and film, shelves of vinyl records and books. A rotary Ma Bell phone weighed a good 3-4 pounds of metal and plastic. When you slammed that thing down it MEANT something. Now it’s all in the palm of one’s hand. Therefore…no inflation. Robotics….no inflation. Cheap manufacturing from overseas… no inflation. Strong USD… no inflation.
Another aspect of new technology that has held down prices is the trend of companies that sacrifice price for market share and growth. Scott Galloway has a great blog on this, linked below. We’ve all seen it with our own eyes. UBER undercutting taxis. Amazon. From Galloway, referencing AMZN: “Inspired by the Seattle giant, and presented with a market that offered billions to ‘disruptors’, firms saw a shortcut: paint a compelling vision and offer $10 worth of services for $5 – negative margins. There are few products that scale like a dollar offered for $0.50.” Here again, the implication is… no inflation.
https://www.profgalloway.com/marginal
Galloway then mentions Netflix: “In the [most recent] earnings call, the company replaced the term ‘growth’ with ‘profitability’ as their go-to word for the call.”
His conclusion: “I believe we are seeing the mother of all shifts from a focus on growth to margin. …Uber and WeWork reflect the high watermark of an infatuation with growth at the expense of margin.”
OK. So what does that have to do with March/March ED spread? If it’s right, EVERYTHING. Because all the things we know about inflation being low and anchored are just that, known. Returning to a focus on margins means PRICE INCREASES.
Here’s an interesting tweet, I think taken from the Atlantic Magazine. “If you wake up on a Casper, work out with Peloton, Uber to WeWork, order DoorDash, Lyft home, get dinner with Postmates, you’ve interacted with seven companies that will collectively lose around $14 billion in 2019. Use Lime, Wag and Blue Apron, that’s three more that have never recorded a dime in earnings.” These guys are SUBSIDIZING consumer prices to buy growth (thanks Softbank!). Or shall we say WERE. A shift will be critical.
It’s well known that low rates have enabled companies now known as ‘zombies’ to service debt and continue operations with ‘margins’ that wouldn’t otherwise make economic sense. Then skim through a Hoisington Quarterly review by Lacy Hunt and you will wonder why US rates aren’t already at zero.
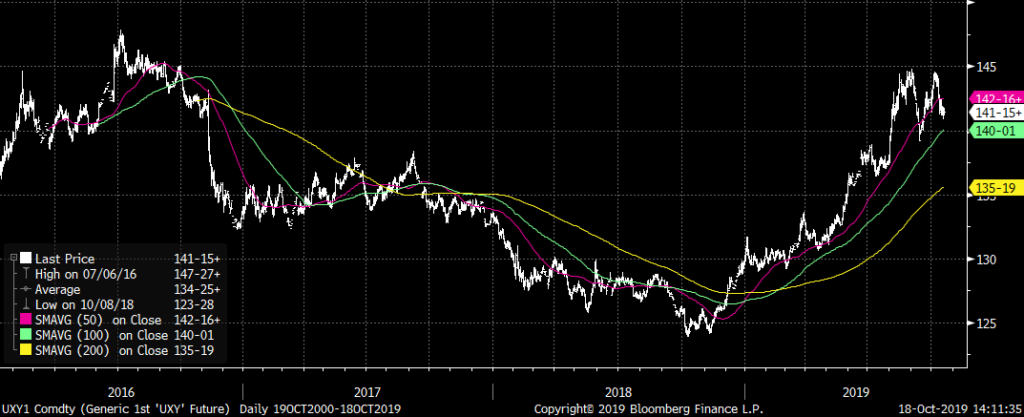
All of this we know, right? But what is the market starting to say? I look at a breakout of March/March, and I say, hmmm, if the market is no longer stubbornly positive that forward rates are not going further down by a lot (and that’s what the reds on the euro$ curve are starting to say) then maybe funding of a ten year position, when it has rolled to eight and a half years left, isn’t going to be all that easy. Maybe that’s one red flag related to September’s repo surge. Maybe the deferred end of any longer term asset needs to have a higher implied yield (and that includes stocks). Perhaps a return to what we used to call ‘term premium’ is in the cards. If that’s the case, then tens will break that downward sloping trendline, which would be similar to what happened in the latter part of 2016 when the one-year ED calendar spread seemed to lead the rate rally. But let’s not just look at the US. The German bund is at the highest yield since late July at -38. The German Schatz has exploded to -66.3 bps, having been as low as -92 in early Sept. The ten year JGB closed through a downward sloping trendline and finished the week at a new recent high of -14 bps. We are starting to see higher lows and higher highs in terms of yields. Look at a constant maturity Ultra-ten year treasury chart (4 year history below). Huge rally from Q4 2018 until the summer. Since then, a potential double top.
Everyone on the trading floor used to mutter, “We’ll find out what’s causing this move later.” We all know what we know. The market seems to be telling us something different. The good floor traders never let their bias for fundamentals get in the way of market signals. And, it’s not just the market. Globally central bankers and other policy makers are voicing a nagging concern that negative rates and QE might be having unintended side effects.
There is a lot of room for higher yields. The question is, can higher inflation ever occur in the context of slowing global growth? Yes, if a shift towards higher margins and profitability takes hold. When zombies die, pricing power comes back into play. Let’s take the biggest disruptor of all, China. If there’s one thing the trade war has done, it has ended the model of China solely relying on manufacturing cheap products to export to the US. No more vendor financing. From Credit Bubble Bulletin, “Chinese GDP expanded at a 6.0% yoy pace during Q3, the lowest level since 1992. According to Bloomberg, ‘Consumption’s contribution increased to 60.5% from 55.3%. Investment’s contribution slowed to 19.8% from 25.9%.’” Changes in the composition of GDP represent a change in the old model.
One more tweet related to the possibility of higher rates, this in the form of treasury supply: “UST Issuance on tap; Next week we will have $113B in coupon issuance, plus $20B in FRNs on top of an estimated $182B in treasury bills. Total projected debt issuance for the week of $315 Billion.”
According to TBAC (Treasury Borrowing Advisory Committee), this weeks’s coupon issuance of 2 yr notes and FRNs, 5’s and 7’s, raises over $33 billion in new debt.
OTHER MARKET/TRADE THOUGHTS
The Brexit situation still seems to be in flux; it’s not clear what the outcome of this weekend will be aside from a pullback in the pound.
On Thursday. Vice President Pence is slated to give a China policy speech, which may dampen enthusiasm for progress on trade and thus weigh on stocks. The choice between markets and moral high ground is becoming more apparent across the business landscape, and not just with respect to China. Several large tech companies report this week (MSFT, INTC, TXN) which might also impact equity futures.
On Friday, Oct/Nov FF spread settled -19.75, signaling high odds of a 25 bp cut on Oct 30, while Nov/Jan settled at -10. The latter spread prices for an ease in December, now at less than 50/50. Oct FOMC just one and half weeks away, and thankfully, we’re in the Fed speaker blackout period.
The longer term outlook is for higher rates, especially further out the curve. As mentioned last week, I like outright puts and put spreads.
EDU20 and EDU22 both settled exactly at 9850. The front straddle settled 48.0 and the green midcurve at 55.0. Not sure which one I’d rather own, but I am not too inclined to be short, even in a week where domestic economic news is fairly light.
Once again, the theme of this note is longer term in nature, and not conducive to a bunch of short term trades. Parameters are wider. Size trades accordingly.
| 10/11/2019 | 10/18/2019 | chg | |
| UST 2Y | 161.6 | 157.4 | -4.2 |
| UST 5Y | 158.2 | 155.8 | -2.4 |
| UST 10Y | 175.5 | 174.7 | -0.8 |
| UST 30Y | 221.6 | 224.5 | 2.9 |
| GERM 2Y | -72.0 | -66.3 | 5.7 |
| GERM 10Y | -44.2 | -38.2 | 6.0 |
| JPN 30Y | 38.3 | 40.9 | 2.6 |
| EURO$ Z9/Z0 | -35.0 | -36.0 | -1.0 |
| EURO$ Z0/Z1 | -7.0 | -3.5 | 3.5 |
| EUR | 110.38 | 111.70 | 1.32 |
| CRUDE (1st cont) | 54.78 | 53.87 | -0.91 |
| SPX | 2970.27 | 2986.20 | 15.93 |
| VIX | 15.58 | 14.25 | -1.33 |
https://www.profgalloway.com/marginal

