Nov 8. The Shakeout begins
Goodbye Mr Magoo

–Implied vol in treasuries evaporated as fast as Jim Acosta’s press pass. Unceremoniously dumped like A.G Sessions. As an example. USZ 137.5^ went from 2’00 at Tuesday’s close to 1’34 yesterday, a loss of 23% (Only 2 1/2 weeks til expiry, but still!). Dec green and blue midcurve 9675 straddles from 18.5 to 16.0. Large relief rally in stocks, but it appears as if there might be some second thoughts this morning. The walk of shame.
–It was a very bearish end of the day in the thirty year bond as auction demand was shallow. Outside day in the contract (USZ) but a lower close, and late selling put it close to the 137 strike. Often there is a rally out of the last leg of the auction; this trade action is a large warning flag for bulls. (Although Ultra bond closed with a marginal gain).
–It’s not just the long end of the market that is suspect. Near FF contracts also closed at their previous lows. The Fed effective rate has been coming in at 2.20% or 97.80, and Nov FF closed spot-on at 97.7975. Going into today’s FOMC the Jan contract settled 97.60, 20 bps above the FedEff, so the market looks for a hike with a 5 bp tweak to IEOR. Further back, the April contract settled at 97.415, 18.5 under Jan and essentially at the previous low of 97.41. While the short end confidently projects that the Fed will hew to a schedule of gradual hikes, it might get a bit messier at the long end. It’s also interesting in the middle: green/blue pack spread settled at a new recent low of -4.875. This inversion doesn’t seem to be abating, and indicates a stalled economy in the next couple of years.
–A couple of anecdotal items. Consumer Credit increase was lower than expected in Sept at $10 B, with a decline in Revolving Credit. (Non-revolving is autos and student loans. Driving an Uber, Back to School). A headline on Reuters notes that China October exports were surprisingly strong in an effort to beat the tariffs. Coincidentally, US inventories rose, boosting recent GDP data. What if we stuffed the inventory channel and no one used their credit cards to buy it?
A couple of technical notes inspired by colleague RW who relates these data to calendar spread rolls.
Peak 2yr open interest in May 2.301m contracts, Drop in June to 1.781m, Increase in the past three months 1.957 on Aug 6 to 2.476m now, an increase of 520k or 26% RECORD OI
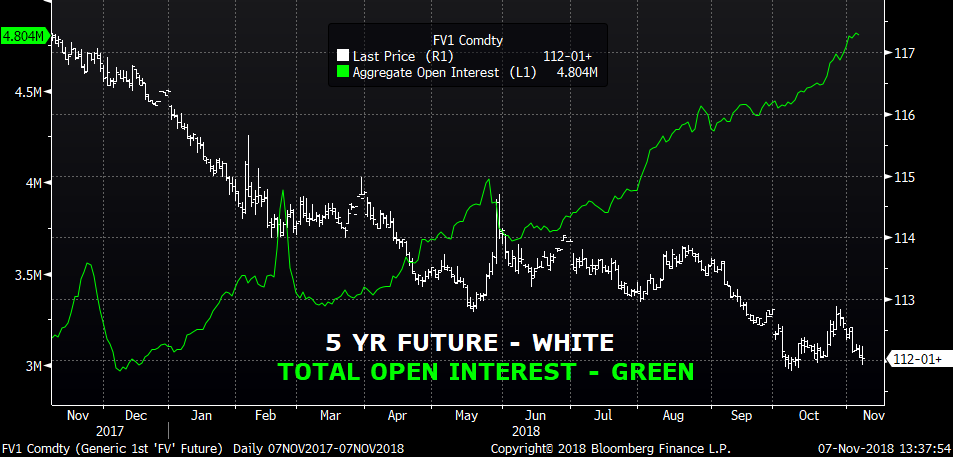
Peak 5yr open interest in May 4.020m contracts, Drop in June to 3.681m, Increase in the past three months 4.174 on Aug 6 to 4.804m now, an increase of 630k or 15% RECORD OI
Peak 10yr open interest in May 4.185m contracts, Drop in June to 3.383m, Increase in the past three months 3.773 on Aug 6 to 4.260m now, an increase of 487k or 13% RECORD OI
Peak 10 ultra open interest in May 605m contracts, Drop in June to 528m, Increase in the past three months 573 on Aug 6 to 667m now, an increase of 94k or 16% RECORD OI
Peak 30yr open interest in May 939m contracts, Drop in June to 801m, Increase in the past three months 840 on Aug 6 to 926m now, an increase of 86k or 10%
Peak Ultra open interest in May 1.099m contracts, Drop in June to 964m, Increase in the past three months 1.031 on Aug 6 to 1.071m now, an increase of 40k or 4%
Open interest is at record levels in the: Two Year, Five Year, Ten Year, Ultra Ten Year. Does this represent activity In rate etf’s? Due to unwinding of Fed’s balance sheet? Should it partially lead to option premium demand? Clearly the increases in the short end are related to hedging activity given Fed rate increases.


