July 1. Investment Grade? – Weekly Comment
In the aftermath of the GFC, the rating agencies came under fire for having given investment grade ratings to dubious securities, primarily in the mortgage market. Should we now be concerned about corporate debt ratings? The market says “Yes”.
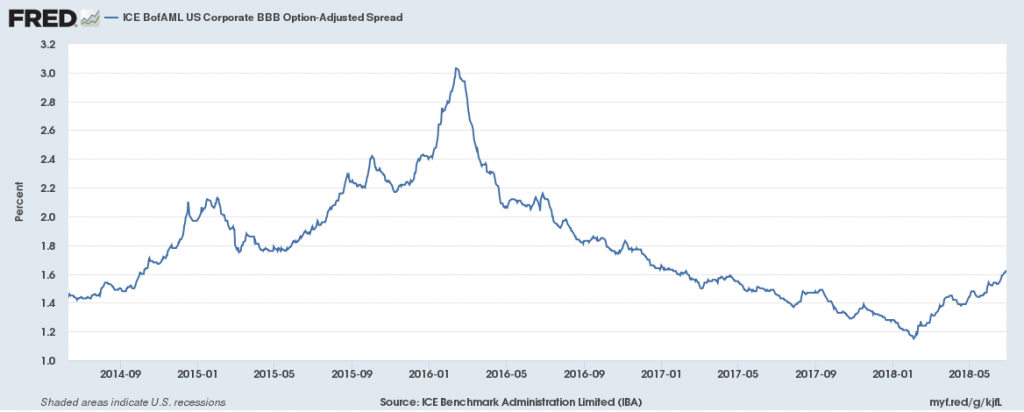
Chart below shows rise of BBB spread since the start of the year. Spike in 2016 related to energy.
What several analysts now point to is the large and increasing percentage of BBB/BBB- in the investment grade universe. This is becoming a hot topic, as evidenced by the following snippets: From Almost Daily Grants June 26, “According to data from FactSet, investment-grade debt has been the worst performing major asset class year-to-date through June 21 with a 3.6% loss, trailing Treasurys (down by 1.4%), high-yield (green by 0.7%), stocks and commodities (both higher by more than 3%).”
Here’s a clip from Business Insider in April 2018: “The ballooning of BBB-rated debt as a share of the overall investment-grade bond market comes as U.S. corporations heap debt onto their already leveraged balance sheets. The outstanding value of BBB-rated debt is around 42.2% of the entire investment grade market, comparing with 26.1% in 2007.”
From the MacroTourist last week: “The past five months have been brutal to investment-grade credit investors. IG OAS has risen from 95 bps in late January, to 140 bps today. This is a big move for investment-grade bonds. It is an especially big move considering the fact that most other risk assets are not following suit.” He further notes that the ratio of Hi Yield to IG is the lowest it has been since 2009 (the yield spreads are converging).
From the FT June 29: “Investment-grade US corporate bonds recorded a second negative quarter in the three months to the end of June, marking the first back-to-back losses since the financial crisis, as the Federal Reserve raised interest rates and foreign buyers of corporate bonds retreated in the first half of this year.”
There was also a note from BofA citing some of the same concerns regarding European debt. From ZH (attributed to BofA): “Since the beginning of 2015 (PSPP started in March ’15) the size of the BBB-rated non-financial sector has grown from €450bn to €755bn (66%). Conversely, the size of the Euro high-yield market has shrunk from €310bn to €285bn over this period.” The ECB can buy investment grade debt, so high-yield issuers have a big incentive to squeeze onto the next rung higher on the quality ladder. But what happens in a recession with downgrades?
Regarding size of the markets, in 2008, when MBS was the problem, the amount of US mortgages outstanding was $10.61T, total Business debt was $10.66T and Corporate was $6.57T. As of Q1 2018, Mortgage debt outstanding is actually lower at $10.14T, total Business is $14.43T and Corporate is $9.06T. Of course, the elephant is Fed’l debt, from $7.38 to $17.08.
The broad concern is that there is a lot of debt teetering just above junk status, and perhaps rating agencies are not being as stringent as they should. With 2 consecutive quarters of negative returns in IG, and an increasing spread, the market is giving a pretty clear warning that probably shouldn’t be ignored.
Of course, another fragile spot is emerging markets. From BBG on June 29: “Asian high yield dollar bonds are set to post the biggest quarterly loss since 2013, with Chinese companies leading declines, as a heavy pipeline of new bond deals and rising defaults dented market confidence. Asian junk bonds are set to post negative returns of about 3.3% in 2Q after a loss of 1.1% in 1Q, making it the worst quarter since 2Q 2013…”
For a great summary of the quarter see this blog from Doug Noland
http://creditbubblebulletin.blogspot.com/
When looking back at emerging market strife in the late 1990’s, most charts don’t really reflect the same sort of disruption now as then. In late 1997 the Malaysian ringgit and Indonesian rupiah and India rupee crashed. In 1998 it was the Russian ruble (and related collapse of Long Term Capital Mgmt). In early 1999 the Brazilian Real plunged. In the current episode Argentina and Turkey have been standouts, and of course, several other countries have had to raise rates to stem capital outflows. On Friday Indonesia raised 7-day reverse repo 50 bps to 5.25. June 21, Bank of Mexico raised overnight rate to 7.75%. June 6, RBI raised repo rate from 6.0 to 6.25%. Rising rates and vulnerable currencies are headwinds to global growth.
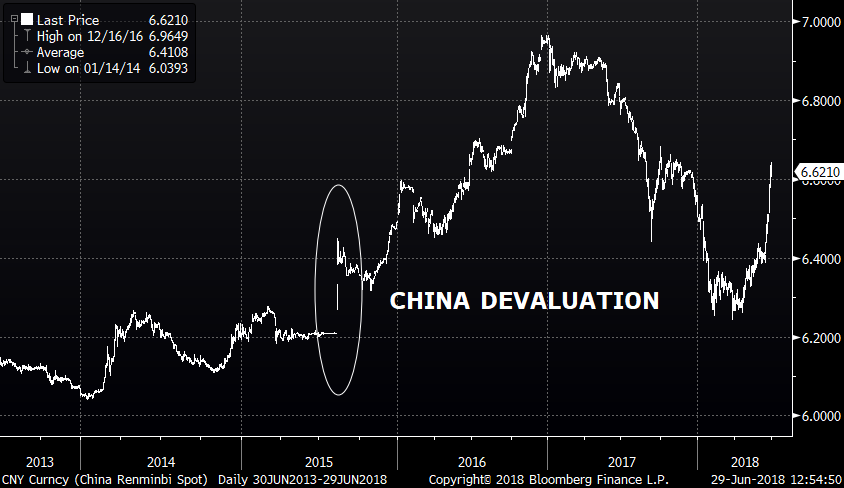
Many recall when the summer month trading lull of 2015 was jolted by China’s devaluation in August. However, as the chart below shows, this month’s decline in the yuan from 6.40 to 6.62 is around the same magnitude. Powell’s Fed is turning a deaf ear to growing imbalances, hesitant to ride to the rescue whenever market forces threaten financial asset prices. It’s a fine line.
Although several Fed Presidents like Bullard and Bostic have cautioned about hiking too quickly, Powell is more focused on the performance of the domestic economy. Williams has been silent. Quarles gave a speech last week about international financial linkages, but it was largely a vote of confidence in the FSB or Financial Stability Board. There has been discussion about the flatness of the curve, but for now the signal is being ignored. Core PCE prices finally hit the Fed’s target of 2% last week. Q2 growth was likely in the high 3% range. This Friday’s Employment report will show continued improvement in labor conditions with NFP expected 200k and Avg Hourly Earnings +0.3 mom and +2.8% yoy.
For curve traders, it really comes down to how close the Fed is to ending its hiking campaign. Most measures of the curve are at their flattest levels of the cycle. I have included below a chart of the red to green Eurodollar pack spread (2nd to 3rd year forward) which closed just barely positive on Friday at 1.125 bps. On a long term basis, this area appears to be a buy. But steepening really occurs when the Fed is DONE. At the end of 1994 it was the 75 bp hike in November to 5.5% that turned the tide (though there was another hike in Feb 1995). In 2000 it was the 50 bp hike in May to 6.5% that capped the move. In 2006 the cycle of 25 bp hikes at every meeting culminated in June, topping at 5.25%. This month’s hike put the Fed Fund target at 1.75 to 2.00, well below previous tops. While the market is indicating that the Fed is tight, it’s just not clear that the Fed itself is accepting that message. The result is that there are a lot of conditional steepeners that have been entered on the dollar curve, that is, buying near calls and selling deferred, usually with a long delta bias. My personal view is that the Fed will maintain its hawkish bias at least through a September hike. As of Friday, the August/October FF spread, which isolates the Sept 26 FOMC, is 18, or around 3 in 4 odds of a hike. EDU8 settled 9754.5, or 13 bps higher in rate that the EDM18 expiration. Because rates are much lower in this episode, I think greens are likely to be the pivotal part of the curve. June’s FOMC minutes will be released on Thursday, and may provide enhanced clues about the Fed’s outlook.
MON: ISM Mfg 58.3 from 58.7. Prices paid last was 79.5, expected 74.7 which was highest since 2011.
TUES: Factory Orders 0.0
THUR: ISM Service 58.2 and FOMC minutes***
FRI: NFP 198k from 223k; Rate 3.8%; AHE 0.3% and yoy 2.8%
O
| 6/22/2018 | 6/29/2018 | chg | |
| UST 2Y | 254.5 | 252.8 | -1.7 |
| UST 5Y | 277.2 | 273.3 | -3.9 |
| UST 10Y | 289.9 | 285.3 | -4.6 |
| UST 30Y | 304.1 | 298.8 | -5.3 |
| GERM 2Y | -66.5 | -66.5 | 0.0 |
| GERM 10Y | 33.7 | 30.2 | -3.5 |
| JPN 30Y | 70.7 | 70.6 | -0.1 |
| EURO$ Z8/Z9 | 35.0 | 32.5 | -2.5 |
| EURO$ Z9/Z0 | 1.5 | 1.5 | 0.0 |
| EUR | 116.56 | 116.83 | 0.27 |
| CRUDE (1st cont) | 68.58 | 74.15 | 5.57 |
| SPX | 2754.88 | 2718.37 | -36.51 |
| VIX | 13.77 | 16.09 | 2.32 |
https://www.zerohedge.com/news/2018-06-28/bank-america-spots-eu800-billion-cliff-fills-us-fear


