2016 Rate Hike Cycle Compared to Now
March 20, 2022 – Weekly Comment
In the last hiking cycle, the initial quarter percent hike occurred in December 2015. The next didn’t occur until December of 2016, which was the beginning of a series of hikes which lasted two years and culminated in December 2018 at a top rate of 2.25 to 2.50%. In this note I consider December 2016 as the start of the hiking cycle.
Currently, the lowest contract on the Eurodollar curve is September 2023 which settled 9723.5 or 2.765%. On the SOFR curve, SFRU3 is likewise the lowest contract at 9749.0 or 2.51%. (ED/SOFR spread of 25.5). Though volumes are much more modest and open interest is quite small, the forward FF curve tells the same story, with a low price of 9740.5 for the November 2023 contract. In other words, as of this past week which contained the first FF hike of the new cycle, the market is forecasting a peak at the same level as occurred in 2018, that is, 2.5%. However, this peak is only one and a half years away, and in 2016 the cycle took two years.
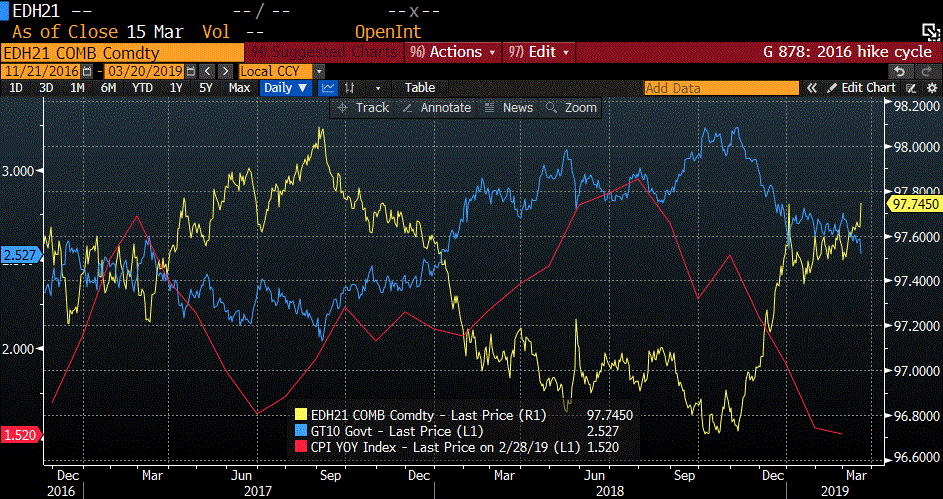
The curve was different in 2016. At that time, the Eurodollar curve was positive through five years. On Dec 21, 2016 the golds (five years forward) were the cheap part. For example, EDH’21 at that time was 9727 and EDM’21 9722. These prices ultimately weren’t all that far off from forecasting the peak FF rate, although the timing was off. As the market began to price the Fed’s withdrawal of accommodation, the ten year popped above 2% in the beginning of November 2016, and hit 2.60% on December 15, 2016, just prior to the actual ‘first’ hike on Dec 19. The high yield in the ten year for 2017 was 2.63% set in March. The actual peak for the ten-year, which has marked the top since 2012, was 3.24% in November 2018, about a month before the final hike. Currently the yield is 2.15%.

Of course, CPI was much lower in 2016. It was 2.1% in Dec 2016, then had an intermediate peak at 2.7% in February 2017 and fell back a bit, ultimately peaking at 2.95% in July 2018. On the chart above, which covers Dec 2016 through Q1 2019, the blue line is the ten year treasury yield and CPI is red. The yellow line is EDH’21 in price, which was Gold March at the time of the chart’s inception. The first thing I would mention about the last cycle is that CPI is below the ten year yield for the entire period except briefly in the middle of 2018. That is, real yields were positive. That’s a glaring difference from today, with CPI at 7.9% and tens at 2.15%. That’s the real conundrum between 2016 and now. Interest rate pricing and the ‘forecast’ of the futures curve isn’t all that different, but the inflation situation is wildly divergent.
In fact, last week Mnpls Fed President Kashkari posted a ‘mea culpa’ paper outlining his change of stance regarding both inflation and the appropriate path for short term rates (link at bottom, well worth review). He specifies his SEP changes. As recently as September, he thought year-end 2022 FF should be 0 to 0.25%. At the last meeting, just six months later, he thinks FF should be 1.75 to 2.0%. In September he thought 2022 inflation would be 1.8%. At the March meeting: “Actual inflation for 2021 ended up being 5.8% and I just increased my forecast this week to 4.5% for 2022.” He now believes it is plausible that we’re in a “high-pressure, high-inflation equilibrium”. Even with that being the case, his SEP projections still leave real rates highly negative through 2022.
Perhaps what the market considers more important going forward is not the FF target or neutral rate, but rather the size and rate-of-change of the Fed’s balance sheet.

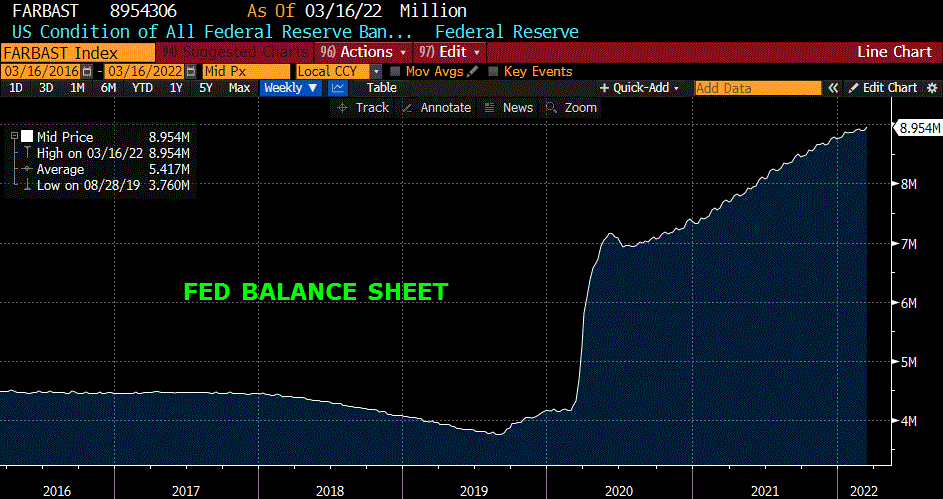
The picture above shows the Fed’s balance sheet. From Q4 2017, the Fed actually trimmed its size, decreasing it by $10 billion per month increments every quarter, ending with $50 billion per month starting in October 2018. As a small reminder, also at the start of October 2018, Powell said “we’re no where close to neutral”. That marked the top for stocks, which slid right into the end of the year, compelling Mnuchin to call the heads of the banks for a meeting to ensure everyone that there would be adequate liquidity. The Fed is now on the cusp of making the same mistake of deflating asset prices too quickly. The balance sheet exploded during the covid period, with the Fed buying $120 billion of securities per month, juicing the stock market, housing and nominal GDP. Household Net Worth is at an all-time high of $150 trillion which is an astonishing 825% of disposable income, versus a 40-year average going into 2010 of around 550%. Is it the size of the balance sheet that matters or the change? Just the halting of Fed purchases should be enough to slow things down, but now many Fed members actually want to start to decrease the size of the balance sheet concurrently with hikes at every meeting. Add to that the fact that Federal Gov’t Spending is decelerating from the torrid covid pace, and that midterm elections will likely result in even more fiscal restraint. Again from Kashkari: “We knew HH balance sheets were much stronger than before the pandemic, because the COVID-19 relief packages were so much larger than the income that was lost due to the pandemic.”
Quantitative easing compels investors to search for yield in riskier assets. Quantitative tightening shifts investor preference from more risky to less risky. This is likely a key dynamic which is flattening the curve and keeping long-end rates relatively contained. It’s all about asset prices.
| 3/11/2022 | 3/18/2022 | chg | ||
| UST 2Y | 174.6 | 195.3 | 20.7 | |
| UST 5Y | 195.6 | 214.1 | 18.5 | |
| UST 10Y | 200.0 | 214.4 | 14.4 | |
| UST 30Y | 236.0 | 241.5 | 5.5 | |
| GERM 2Y | -40.7 | -33.8 | 6.9 | |
| GERM 10Y | 24.9 | 37.3 | 12.4 | |
| JPN 30Y | 87.3 | 89.1 | 1.8 | |
| CHINA 10Y | 279.5 | 281.0 | 1.5 | |
| EURO$ M2/M3 | 100.5 | 131.5 | 31.0 | |
| EURO$ M3/M4 | -20.0 | -27.0 | -7.0 | |
| EURO$ M4/M5 | -8.5 | -22.5 | -14.0 | |
| EUR | 109.15 | 110.51 | 1.36 | |
| CRUDE (active) | 106.30 | 109.33 | 3.03 | |
| SPX | 4204.31 | 4463.12 | 258.81 | 6.2% |
| VIX | 30.75 | 23.87 | -6.88 | |
https://www.minneapolisfed.org/article/2022/update-on-inflation-and-monetary-policy

