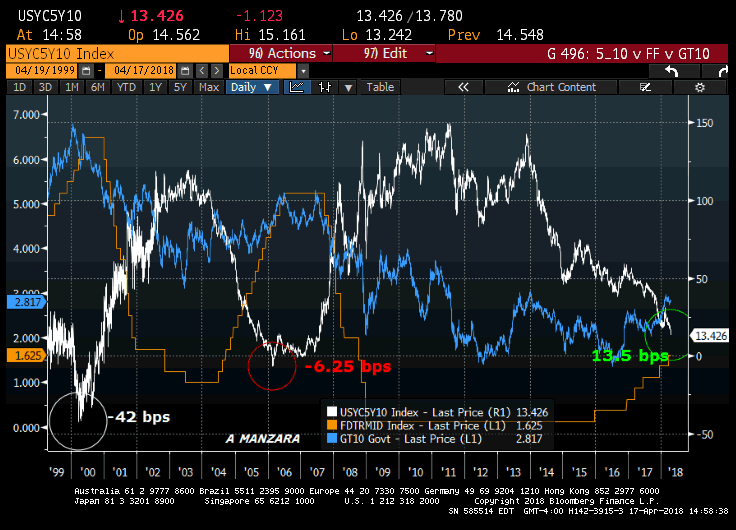
5/10 treasury spread and the nominal level of rates
Below is a chart with 5/10 treasury spread (white) FF target (amber) and Ten yr treasury yield. In 2000, 5/10 bottomed at MINUS 42 bps (as FF were on the way to 6.5% and UST 10yr yield was close to 7%). In the 2004/2006 hike cycle the spread got to MINUS 6.25 bps, but both FF and UST topped out at a lower level than the previous cycle, (both at 5.25%). The curve is again breaking down; it APPEARS as if the Fed is nearing the end of the hiking cycle.
5/10 is 13.5 bps, with Fed Effective at 1.69% and 10y at 2.82%. At these lower nominal yields, it doesn’t seem as if 5/10 should have as much potential to invert to the same extent as previous episodes. Not that I would call this a ‘buy’ signal; indeed red/gold ED spread HAS eclipsed the low set in 2006. It’s only that additional flattening will likely be much more of a two-way grind.


